
Statistics
Fun facts
CERN uses 1.3 terawatt hours of electricity annually, enough to power 300,000 homes in the United Kingdom over the same period. Its power demand varies throughout the year, depending on seasonal conditions and the needs of its experiments.
Between May and mid December, the Large Hadron Collider, is in operation and CERN’s electricity consumption reaches approximately 200 megawatts, about one third of Geneva’s usage. This energy powers the acceleration of protons to speeds nearly equal to the speed of light. When the facility closes for the winter, its power consumption falls below 80 megawatts.
Closer to home, the TI operators answer an average of 45,000 phone calls a year. That is more than 120 calls a day, spread across every hour of the day and every day of the year.
What we count
Every week, the TI operators consolidate what passed through the control room: the alarms received, the calls answered, the work orders raised. These figures are not collected for the record alone. They tell us how the service is actually used, where the workload falls across the day and the year, and which parts of the technical infrastructure are asking for attention.
Read week after week, a number that drifts is often the first sign of a problem that nobody has reported yet.
Alarms
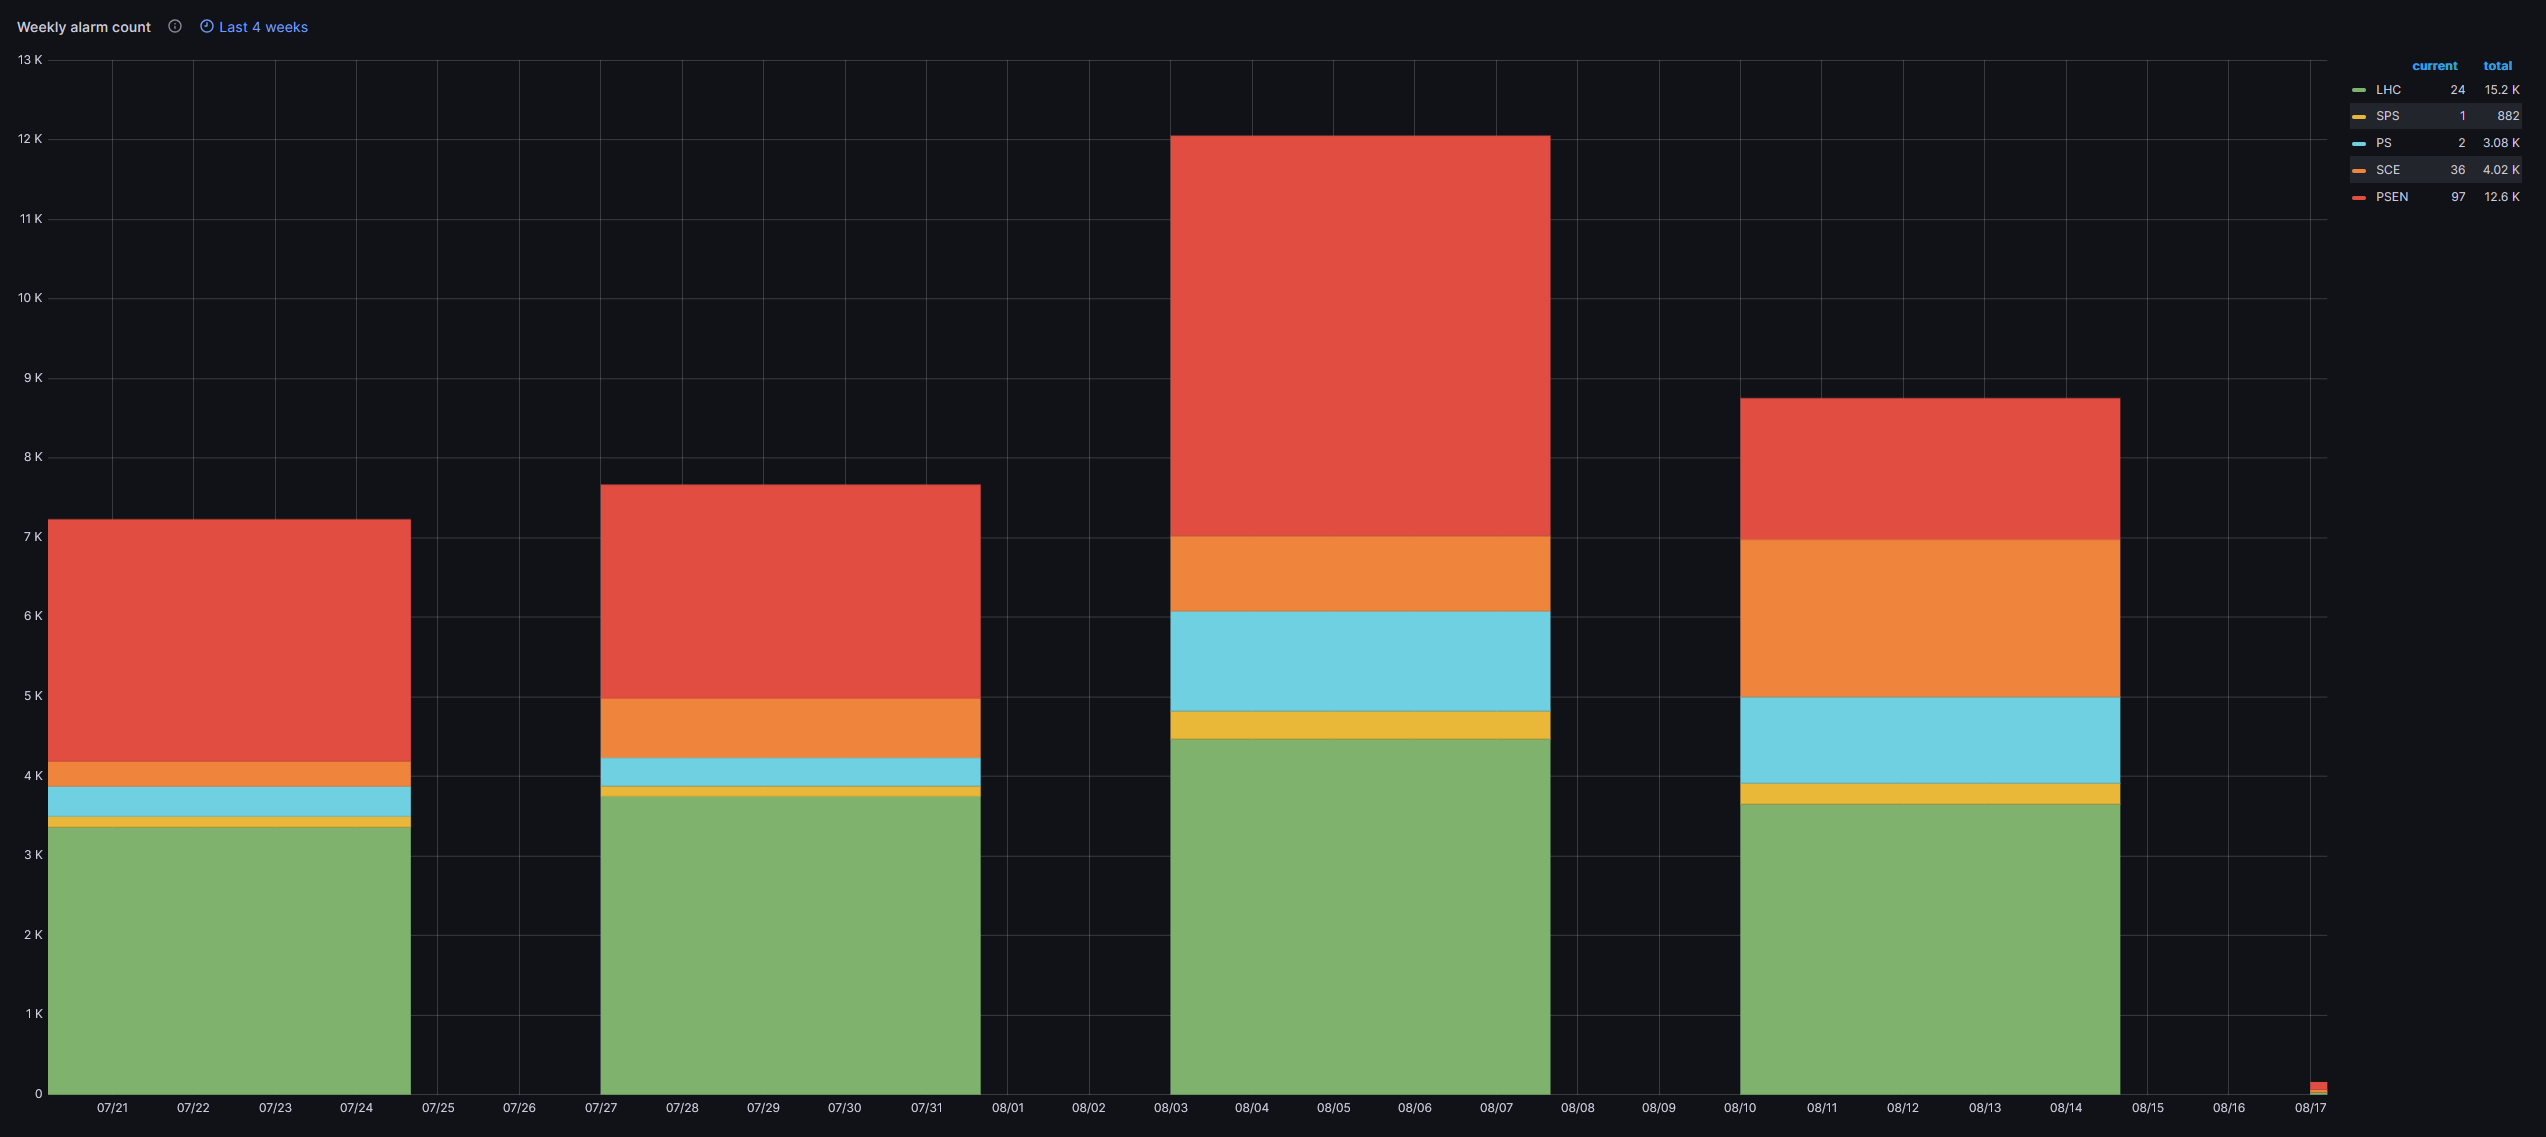
Every alarm that reaches the control room is logged and qualified. Counting them each week turns thousands of individual events into something readable.
The weekly figures are broken down by system, by building and by time of day. What matters is not the total, but the pattern. A piece of equipment that alarms every night, a threshold that fires far more often than the fault it is meant to catch, a building that produces more alarms than all its neighbours combined: these stand out immediately in a weekly series, and rarely in a single shift.
Those observations go back to the equipment owners. Some lead to a sensor being repaired, others to an alarm being reconfigured, retired or given a clearer message for the operator who will see it at three in the morning.
Phone calls
The TI control room is reachable at any hour, and the telephone remains the fastest way to reach it.
Counting calls weekly shows us where the demand really sits: the hours of heaviest traffic, the difference between a working day and a Sunday, and the peaks that follow a major event on the machine. Call volume is our clearest measure of the workload actually carried by the shift.
The nature of the calls matters as much as their number. A subject that returns week after week usually points to information that is hard to find elsewhere, and often ends up as a new procedure, a clearer contact list or a change to the operator documentation.
Work orders
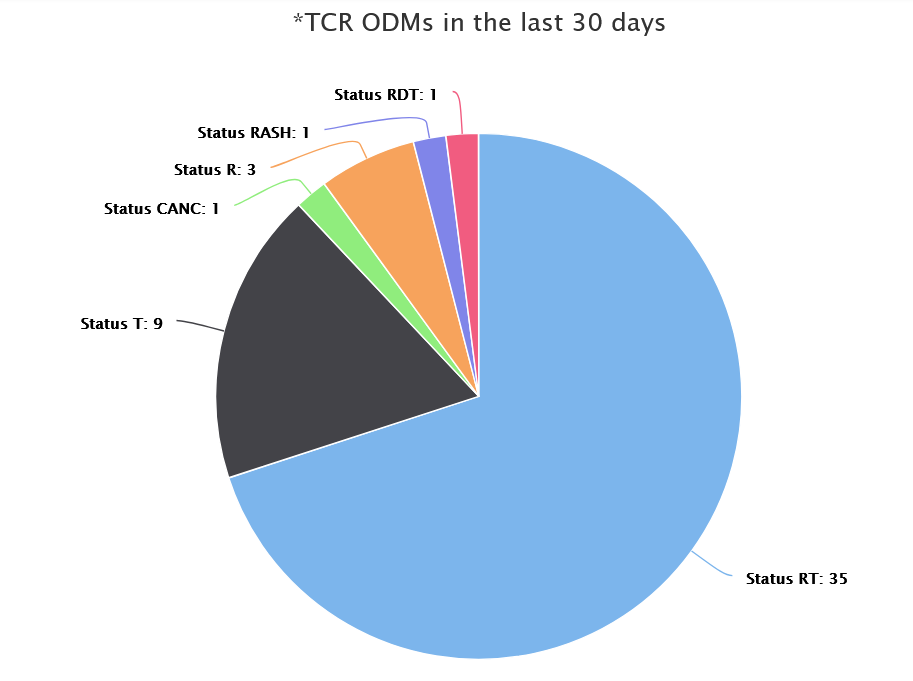
When an event cannot be closed from the control room, TI raises a work order in InforEAM so that the responsible service can intervene, and follows it until the installation is back to normal.
The weekly count shows which installations keep coming back, which services are called upon most often, and how long the loop takes between detection and repair. Recurring work orders are the strongest argument for consolidation. Equipment that appears several times in a month is not an operational nuisance, it is a candidate for renovation, and the figures are what make that case.
Over a full year, the same series exposes the seasonal shape of the work: the winter technical stop, the restart, and the long running periods in between.
What the numbers do not say
The weekly figures are a tool, not a verdict. They describe how much passed through the control room, never how difficult it was to handle.
A quiet week is not automatically a good one. Ten alarms that each required an on duty service to be called out at night represent far more work than a hundred alarms cleared in a few seconds. In the same way, a rise in the alarm count sometimes means the opposite of what it appears to: a new installation has been connected, or a threshold has been corrected, and the control room is simply seeing something it was blind to before.
This is why the figures are always read alongside the operators who produced them. The numbers show where to look. The shift crew, the logbook entries and the services involved explain what actually happened.